
Grouped Stock and Location Report in WMS
Optimize Inventory Management with the Grouped Stock and Location Report in WMS
The Grouped Stock and Location Report in WMS is designed to give you a detailed and customizable view of your inventory. You can group data by Customer Name, Product Name, Group Name, Sub-Group Name, Chamber, or Storage Type to tailor the report to your needs.
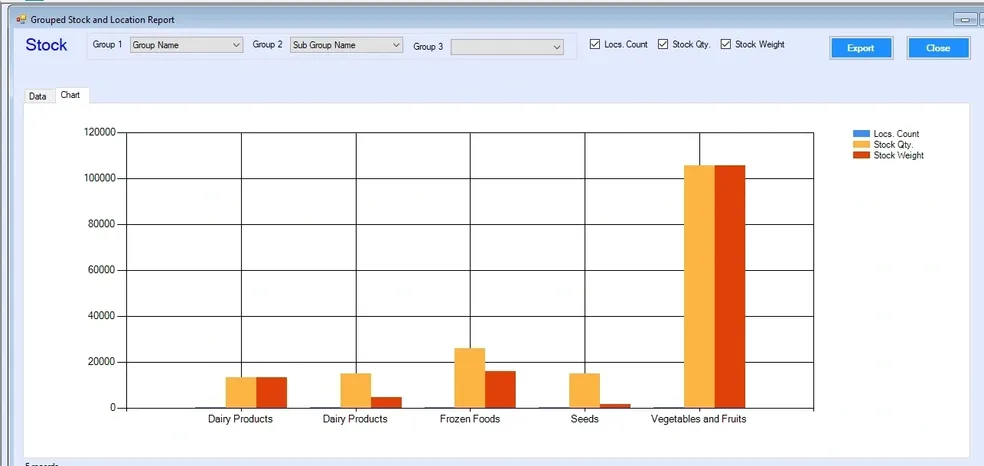
This report provides insights into location counts, stock quantities, and stock weight, helping you understand both the volume and distribution of your inventory. Additionally, a dynamic chart visually represents the data, making it easy to spot trends and make informed decisions.
With this report, you can enhance decision-making, optimize warehouse operations, and strategically plan for the future, ensuring that your inventory management is both efficient and effective.
Key Takeaways
- The Grouped Stock and Location Report in a Warehouse Management System (WMS) provides a structured view of inventory across multiple dimensions.
- It allows grouping by customer, product, category, chamber, and storage type to gain detailed inventory insights.
- The report displays stock quantity, weight, and location count, helping businesses understand inventory distribution.
- Interactive charts help visualize trends, making it easier to identify patterns and optimize warehouse operations.
- This feature improves inventory accuracy, enhances visibility, and supports better decision-making in warehouse management.
Frequently Asked Questions (FAQs)
-
What is the Grouped Stock and Location Report in WMS?
It is a report that provides a detailed view of inventory grouped by different parameters like product, customer, and location.
-
What grouping options are available in the report?
You can group data by customer name, product name, group/sub-group, chamber, and storage type.
-
What insights does the report provide?
It shows stock quantity, stock weight, and location count to help analyze inventory distribution.
-
How do charts help in this report?
Charts visually represent data, making it easier to identify trends and improve decision-making.
-
Why is this report important for warehouse management?
It improves inventory visibility, accuracy, and helps optimize warehouse operations.
Share this Insight
Disseminate strategic knowledge with your leadership network

Related Enterprise SaaS & Engineering Solutions
All Products →Lordist Finance (FMS) SaaS
Multi-entity general ledger, automated bank reconciliation, and cashflow intelligence.
SaaS PlatformEnterprise Order Management (OMS) SaaS
Multichannel order orchestration, ERP integration (SAP/Oracle), and transactional outbox processing.
Supply ChainLogistics TMS & Fleet Dispatch System
Real-time telematics tracking, automated freight rate ledger, and digital proof-of-delivery.
Logistics TechSmart 3D Warehouse Management (WMS)
Real-time 3D location occupancy, FEFO/FIFO inventory allocation, and batch expiry tracking.
Engineering.NET 10 & Next.js Custom Engineering
Bespoke high-concurrency microservices, Azure cloud architectures, and scalable web apps.
Accelerate Your Digital Roadmap
Partner with our seasoned engineering and consulting teams to architect, modernize, and scale mission-critical digital products.