Unlock Sales Insights with the Invoice Report in WMS
The Invoice Report screen in WMS is a powerful tool designed to provide users with detailed insights into their sales performance. Whether you need to analyze sales by customer, month, or week, this report screen has everything you need to make informed decisions and monitor trends effectively. Let’s take a closer look at the key features of the Invoice Report screen and how it can help improve your business operations.
Key Features of the Invoice Report Screen
- Customer-wise, Month-wise, and Week-wise Sales Analysis
The Invoice Report screen allows users to view sales invoice data broken down by different time frames. You can analyze sales by:
- Customer-wise: Get a detailed view of the sales amount for each customer, helping you identify key accounts and track customer-specific performance.
- Month-wise: View total sales on a month-to-month basis, allowing you to track seasonal trends and monthly growth.
- Week-wise: Zoom in on weekly sales data to capture short-term trends and evaluate weekly performance.
This granular view provides actionable insights, helping you make data-driven decisions to optimize your sales strategies.
- Filter by Date Range and Customer
The report allows you to apply filters to focus on specific time frames or customers. Simply set a date range or select a customer to narrow down the data, enabling you to view reports tailored to your needs. Whether you're looking at the past week, month, or a specific customer’s purchases over a particular time frame, the flexibility of these filters allows you to find exactly what you need.
- Branch-wise Reporting
If your business operates across multiple branches, this report offers a comprehensive view of your sales performance. You can choose to view the report for a particular branch or for all branches combined. This multi-branch view enables managers and executives to compare sales performance across locations and identify potential areas for improvement.
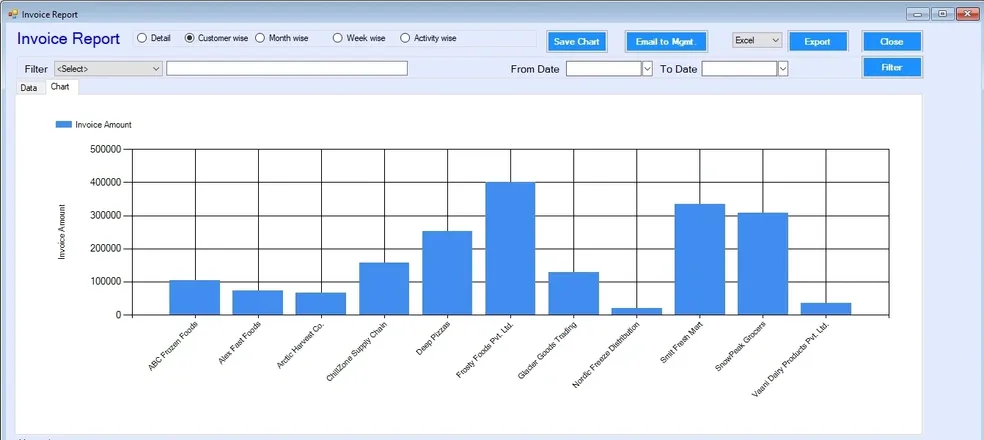
- Visualize Sales with Interactive Charts
To make your data more understandable and visually appealing, the Invoice Report screen includes interactive charts. These charts visually represent the sales invoice data, whether it’s customer-wise or based on a specific time frame like month or week. Users can also save the charts as images for presentations or reports, adding value to your internal documentation and communication.
- Export Options: Excel, PDF, and HTML
In addition to viewing reports on the screen, WMS offers flexible export options to make sharing and archiving easy. You can export your invoice report data in:
- Excel: For further analysis and manipulation
- PDF: For secure and shareable documents
- HTML: For embedding or sharing online
With these export options, you can seamlessly integrate the report data into your workflow or present it to stakeholders in the format that best suits your needs.
- Save Charts as Images
Want to use your sales charts in a presentation or share them with your team? WMS makes it easy to save charts as images directly from the Invoice Report screen. Whether it's for reporting purposes or visual analysis, the option to save charts as images ensures that you can easily incorporate them into external reports or presentations.
Streamline Your Sales Analysis with WMS Invoice Reports
The Invoice Report screen in WMS is a feature-rich, user-friendly tool designed to simplify sales analysis. With the ability to filter by date range, customer, and branch, along with the convenience of exporting data in multiple formats and saving charts as images, WMS provides everything you need to monitor your sales performance and make strategic decisions.
If you're looking for an efficient way to track and analyze sales data, the Invoice Report screen is your go-to solution in WMS. Explore the full potential of your sales data and take control of your business performance today!

